An animation showing the speed and far reach of the spread of COVID-19 across greater Melbourne between March and September 2020, is being shown as a stark reminder to Victorians to continue to practice physical distancing and follow isolation/quarantine orders.
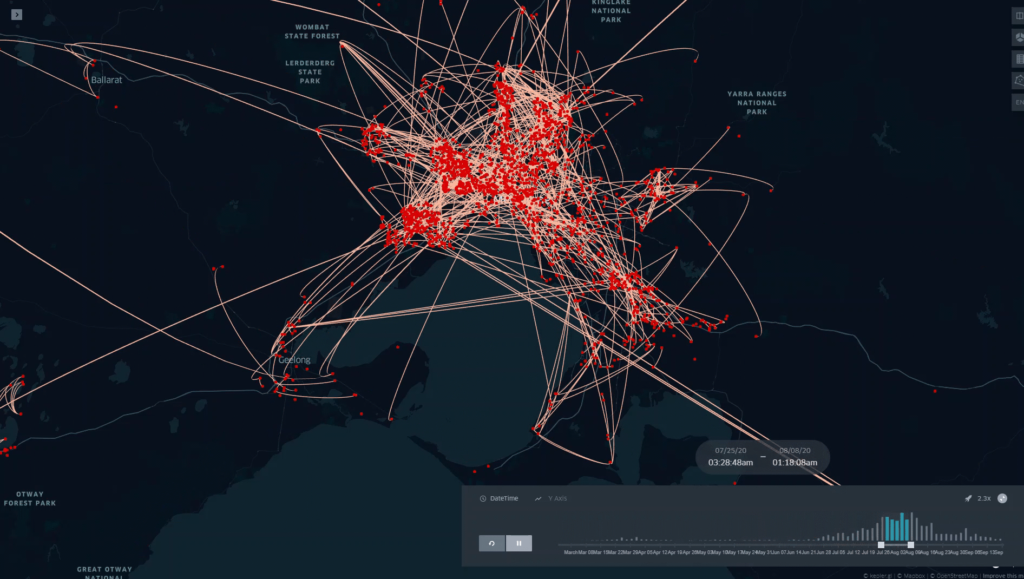
This animation depicts positive COVID-19 cases in Melbourne, Victoria (red dots) and the social contact between (the lines). The location of dots reflects people’s home address, not where they contracted COVID-19. Lines represent possible transmission pathways due to social contact.
The data also highlights the importance of gathering social network data to better understand individuals’ contacts and social networks and the risk of COVID-19 transmission in the community.
Public health experts are emphasising the importance of physical distancing to slow the spread of COVID-19, even as vaccines become available.
This animation was created by Dr Peng Wang, Professor Dean Lusher and Dr Giovanni Radhitio Sadewo from Swinburne University of Technology’s Centre for Transformative Innovation as part of a research project examining targeted intervention of contact networks for COVID-19 with the Victorian Department of Health and Human Services.
Funding: This work was commissioned by the Victorian Department of Health and Human Services.
Watch the full video below: